Reports Overview
Prerequisites: In order to view any Reports in the Predictor Web App, at least one published Simulation is required.
Predictor produces a range of financial, life cycle funding and capital works program reports that can be embedded into organisational long-term strategic asset management and short-term capital works plans.
Predictor provides a suite of reports available on the Web App, some of which can also be run on the Desktop App as a 'Sample Run' in order to validate Model configuration before publishing Simulation results to the Web App.
Predictor Platform Web App Reports
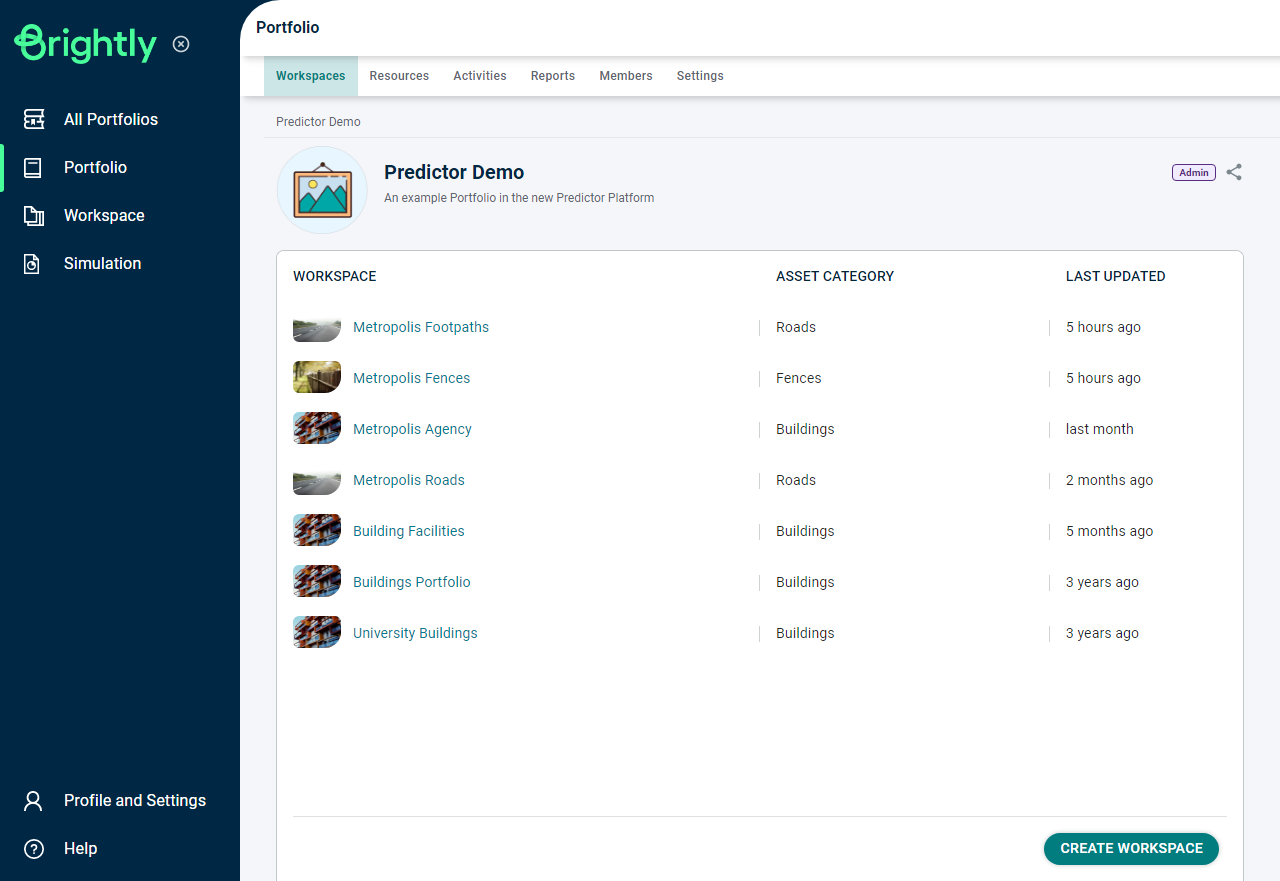
To view reports in the Web App, users must first log in to predictor.assetic.cloud using their Predictor account, and then select a Workspace with at least one published Simulation. Note that each Portfolio can have at most 1000 Reports, and once the limit has been reached, older Simulations must be deleted from in order to ensure that newer Reports can be generated.
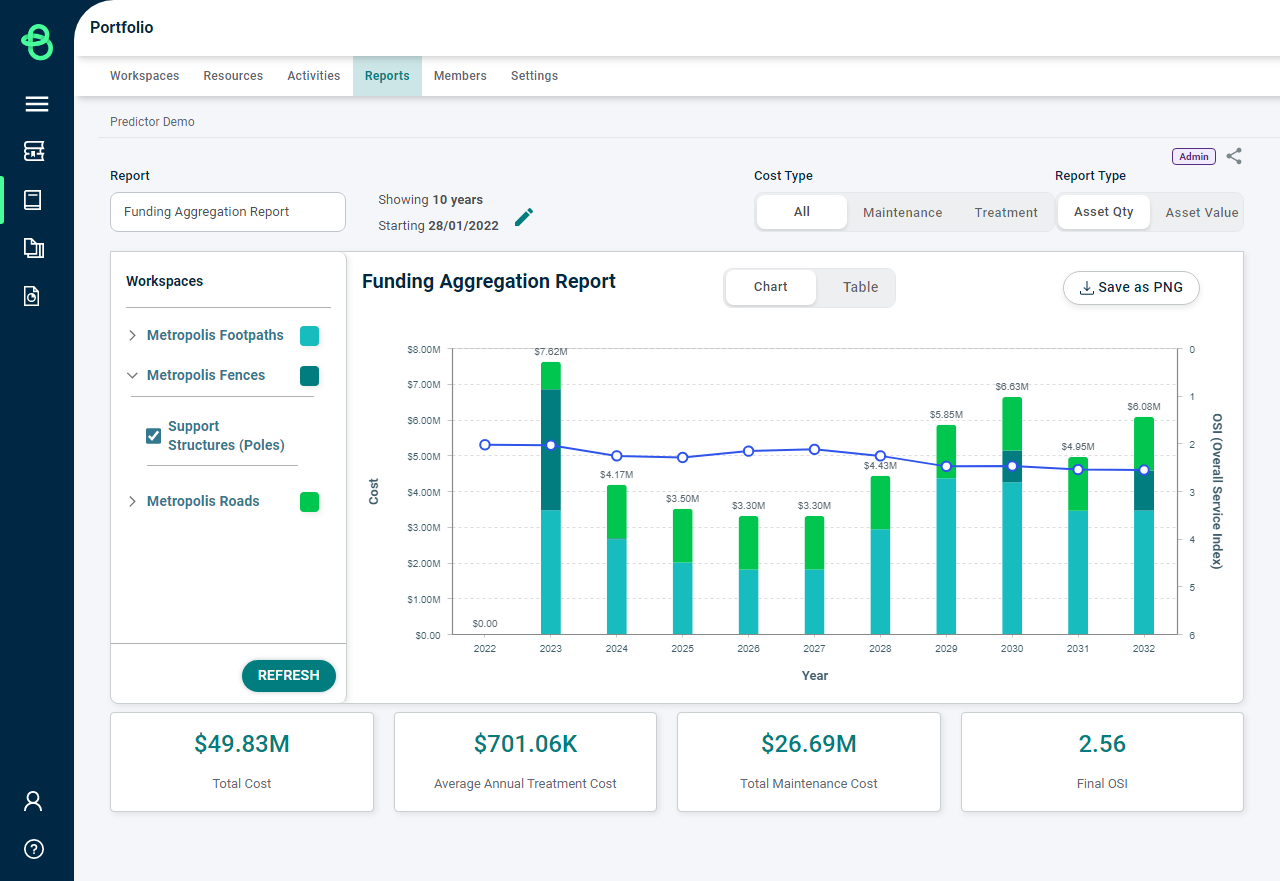
From the Portfolio level, users can click on the Reports tab to view the Portfolio-level reporting which allows for comparison between different Workspaces, the Funding Aggregation Report.
Alternatively, users can open an individual Workspace to view a variety of additional reports. On the Workspace Simulations page, quick reports are available from the 'Lite Comparison Reports' tab, and advanced reports are available from the 'Advanced Comparison Reports' tab.
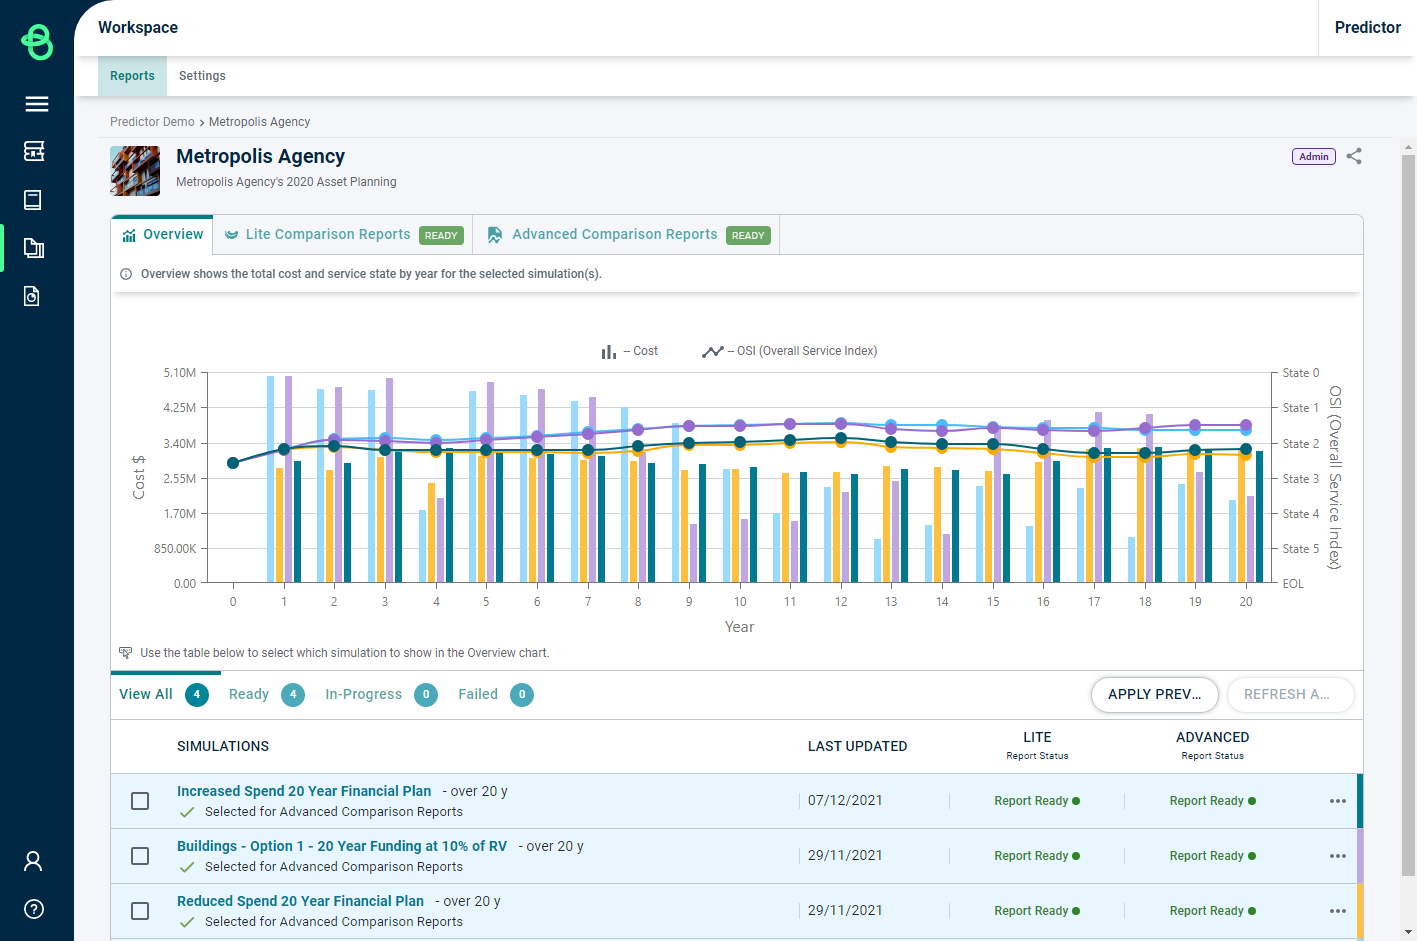
These reports allow users to compare multiple Simulations within the Workspace against each other.
Users use the checkboxes on the left to select which Simulations will be included in the Comparison reports, and then click 'Refresh Advanced Comparison Report' to create the reports. While the Reports are being generated, the status is shown, and a checkmark is used to indicate which Simulations are included in the Comparison reports.
If the Simulations have been updated and republished, users can regenerate the Simulation Comparison reports by reselecting the Simulations to include and using the 'Refresh Advanced Comparison Report' button.
The 'Apply Previous Selections' button will automatically select the Simulations included in the latest comparison reports, so that users can refresh the comparisons with the same Simulations as needed.
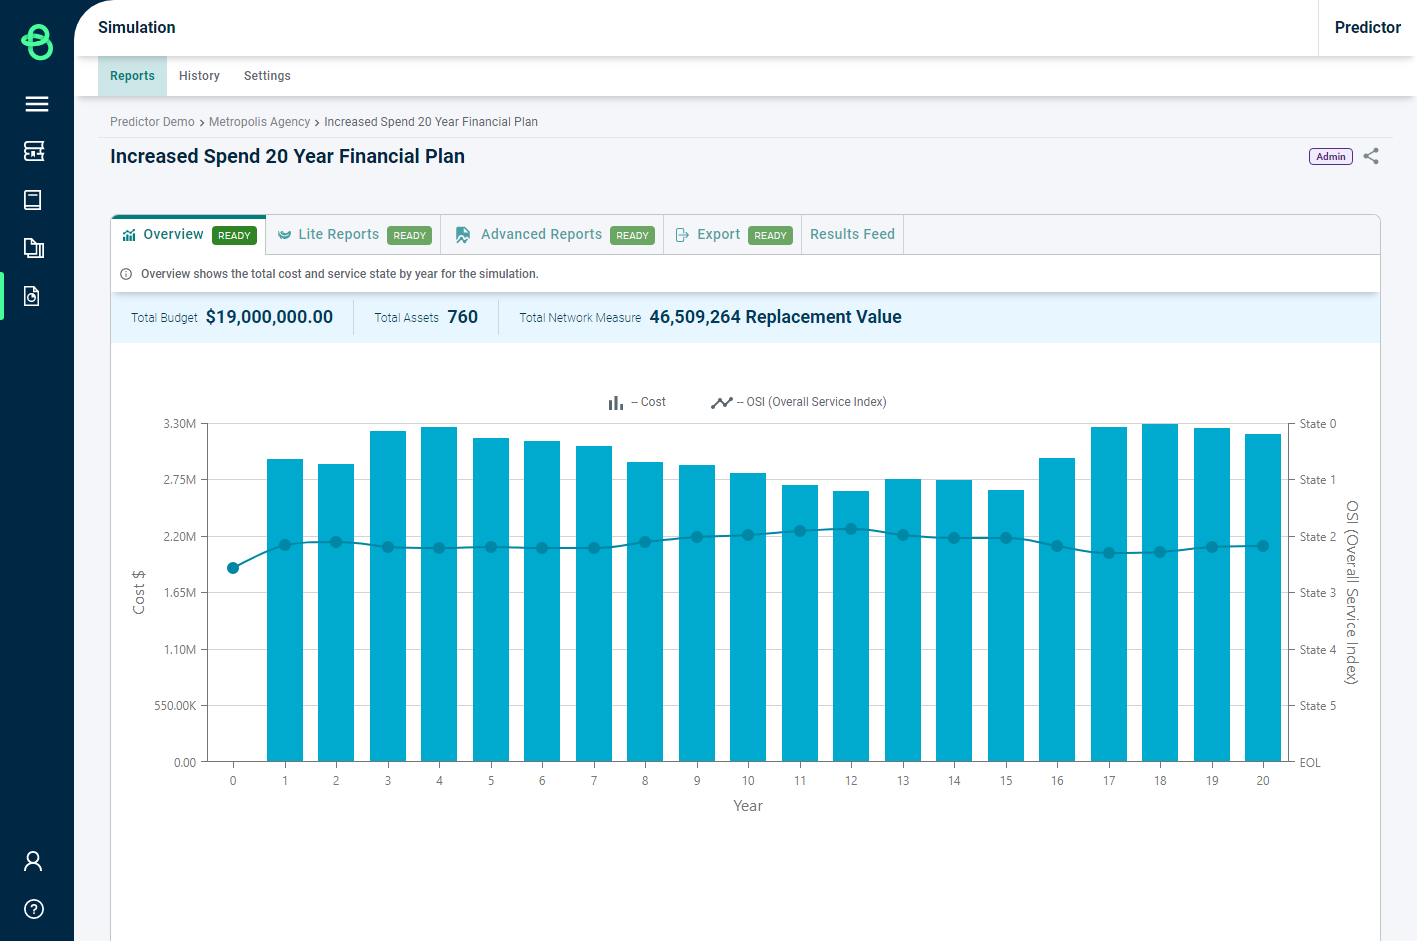
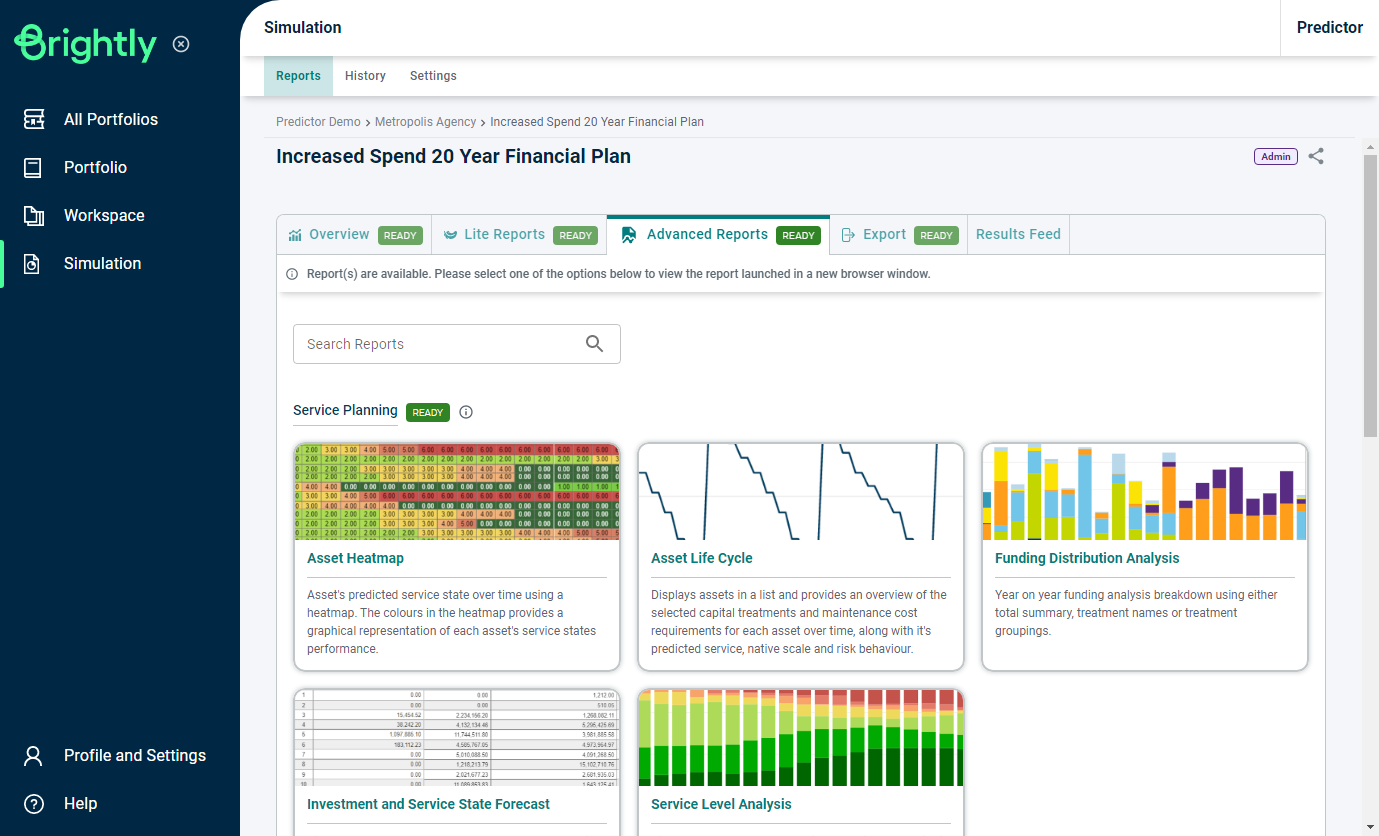
Users can also click on an individual Simulation to load an additional report specific to that Simulation, where users will be able to select between Lite Reports, Advanced Reports, and Exports.
When viewing a single Simulation, users selecting an Advanced Report tile can use the search box to quickly navigate to the desired report:
Report Navigation
Many Predictor Web App reports contain the same navigation elements that can be used in the same way across various reports.
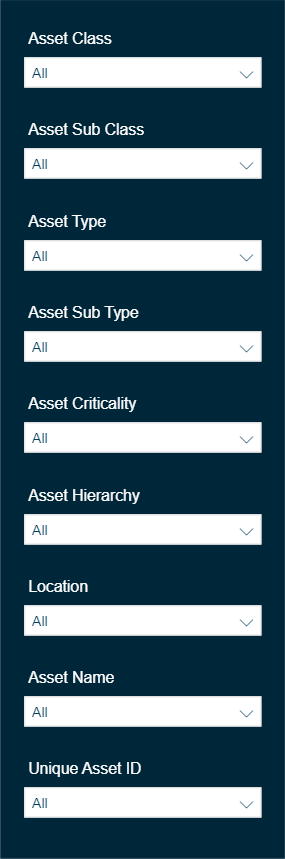
Optional Mapping Filters
When importing Data into a Predictor model, users can map a number of optional fields corresponding to various Asset attributes, which can then be used when viewing most reports to filter based on these attributes:
Report Settings
On the left side of most reports, a number of report-specific settings are shown, which vary from report to report. These include buttons to change the type of chart displayed, the range shown, the service criteria used, etc
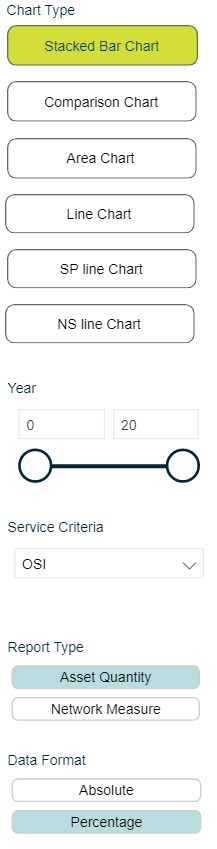
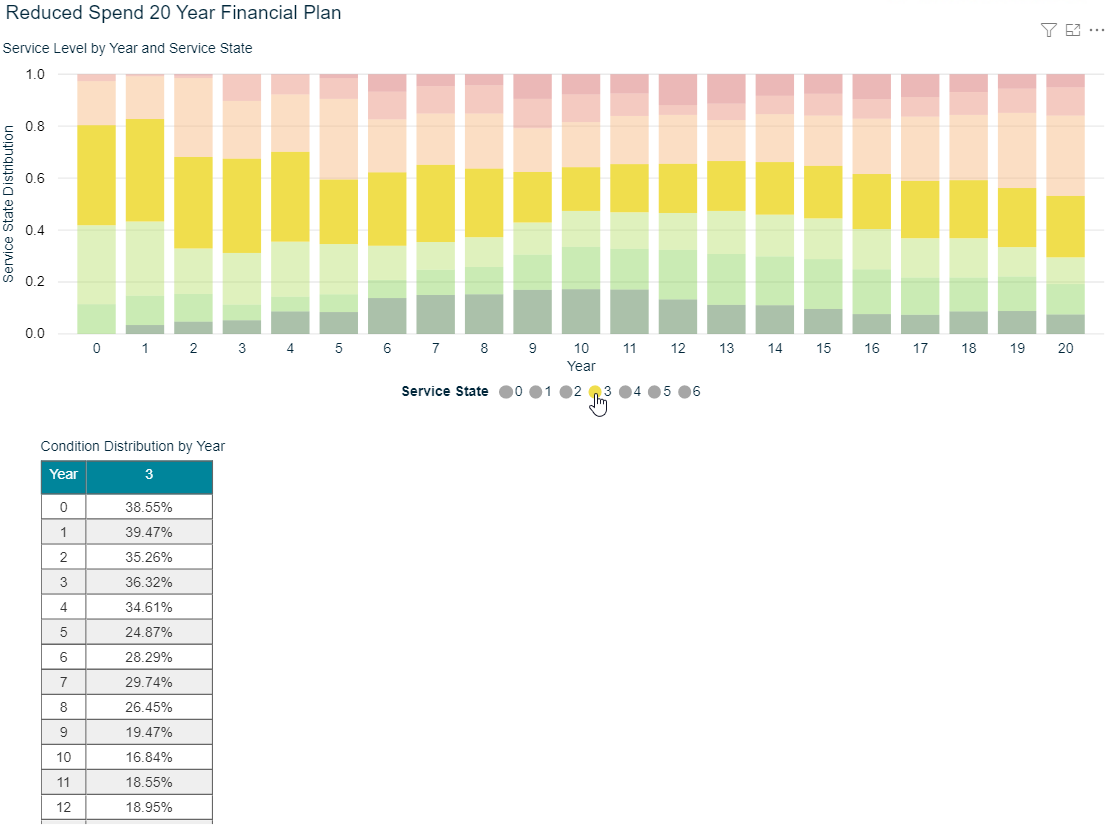
Chart Filtering
The Charts shown in reports are linked to the data displayed in the report, and users can filter the data by selecting specific elements in a chart:
Predictor Platform Desktop App Reports
Sample Run reports are run using a randomly selected 10% sample of the Assets from the model (or all the Assets, if the model contains 100 or fewer), with a proportionally adjusted Budget. Running a report in Sample Run mode allows Desktop users to quickly validate their Model configuration without needing to run or publish the full Simulation, which may contain a substantial amount of data.
In order to view Sample Run reports in the Desktop App, users must launch the Desktop App, log in with their Predictor account, open a Portfolio file, and then navigate to the Template Setup section.
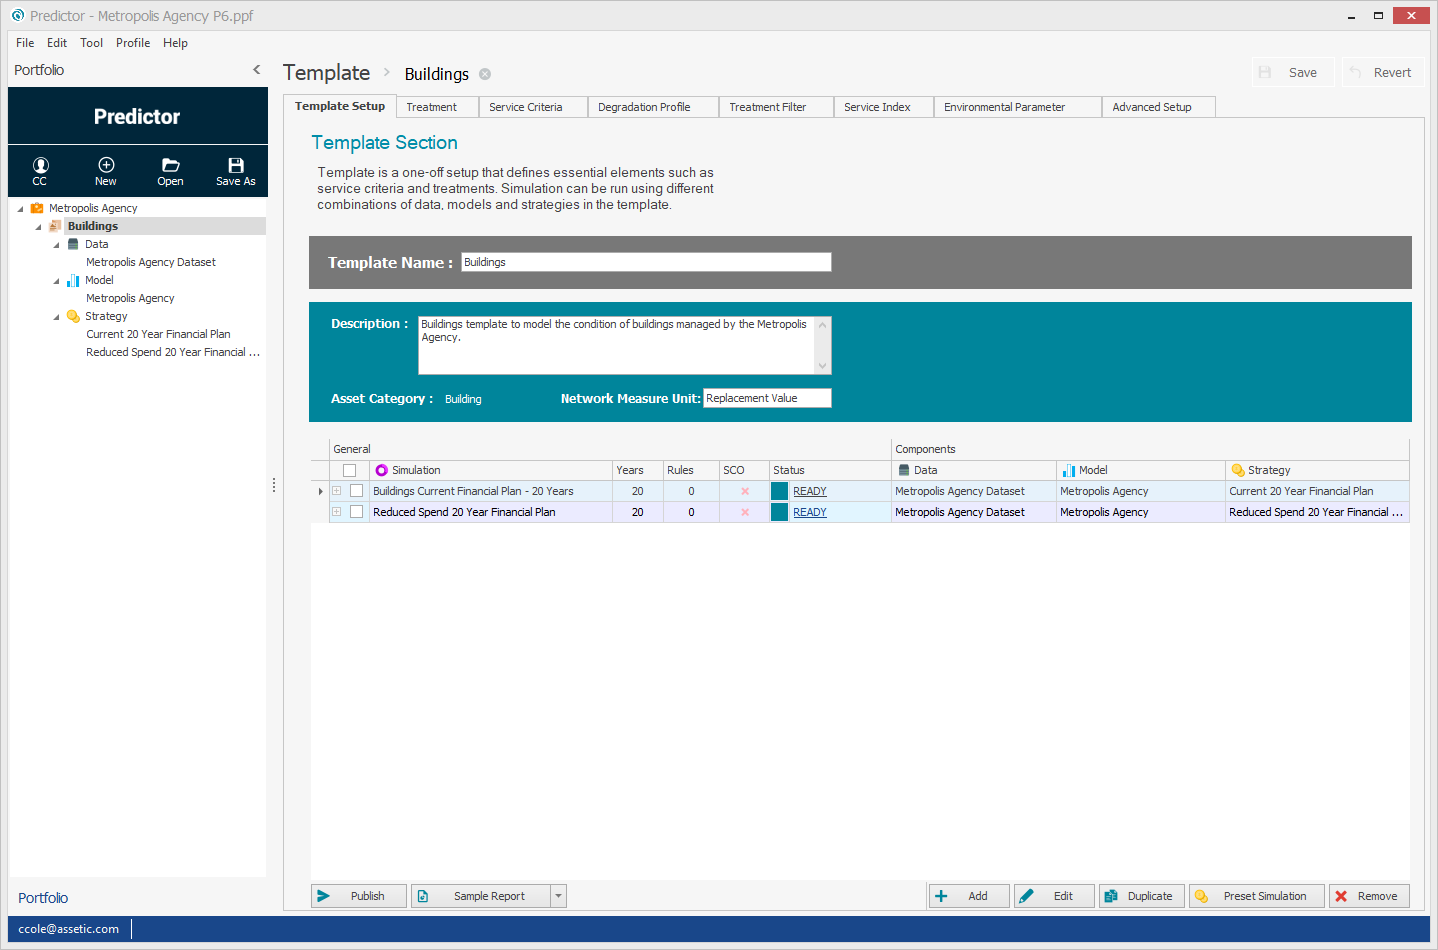
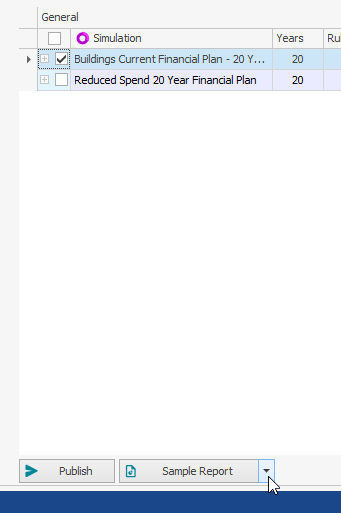
With a Simulation selected, users can either click the Sample Report button to open the Report Viewer or select a specific report from the Sample Report arrow:
In the Report Viewer, users can select the desired Report from the drop-down menu, choose a Simulation, and then select the 'View Report' button to view a 'Sample Run' only version of the report.
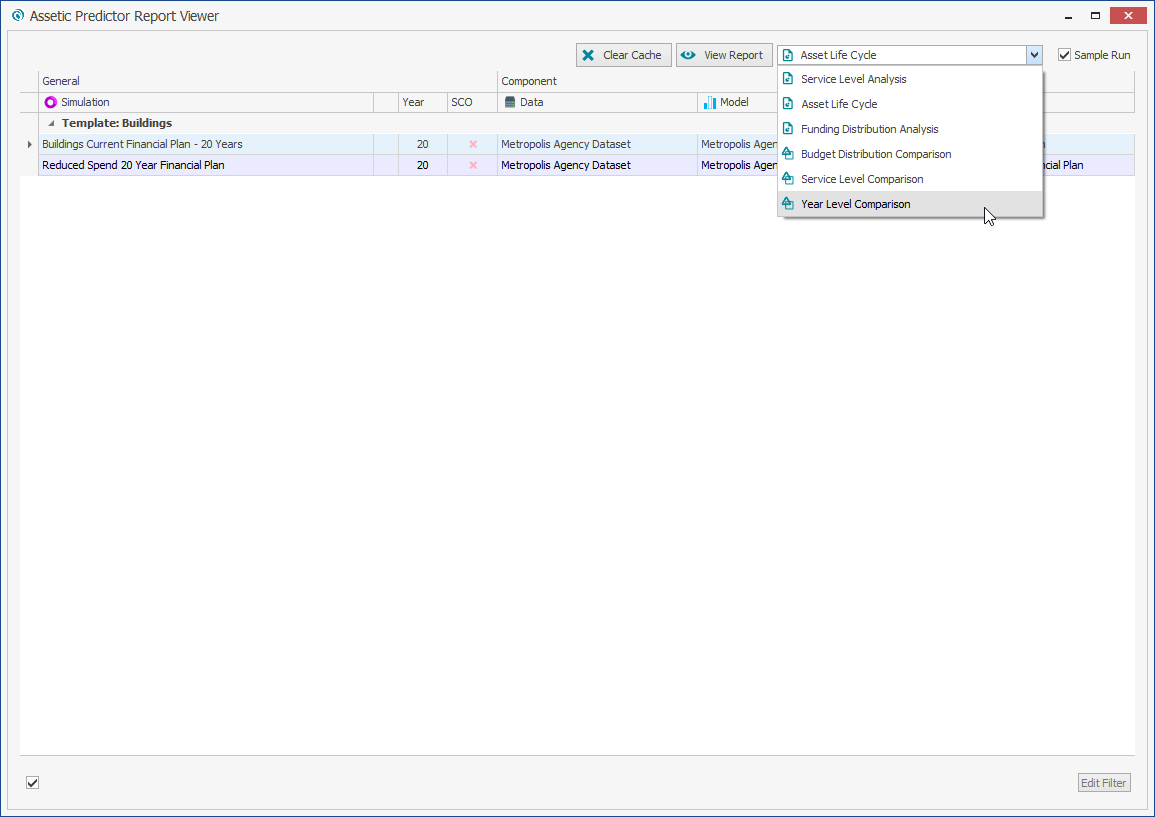
Available Reports
-
Funding Aggregation
-
Budget Distribution Comparison
-
Service Level Comparison
-
Risk Comparison
-
Year Level Comparison
-
Asset Heatmap
-
Asset Life Cycle
-
Funding Distribution Analysis
-
Investment and Service State Forecast
-
Service Level Analysis
-
Net Strategy
-
Risk Analysis
-
State of Assets
-
Works Program Schedule
-
Works Schedule
-
Simulation Export
